

October 20, 2004
Evaluation of timing distributions
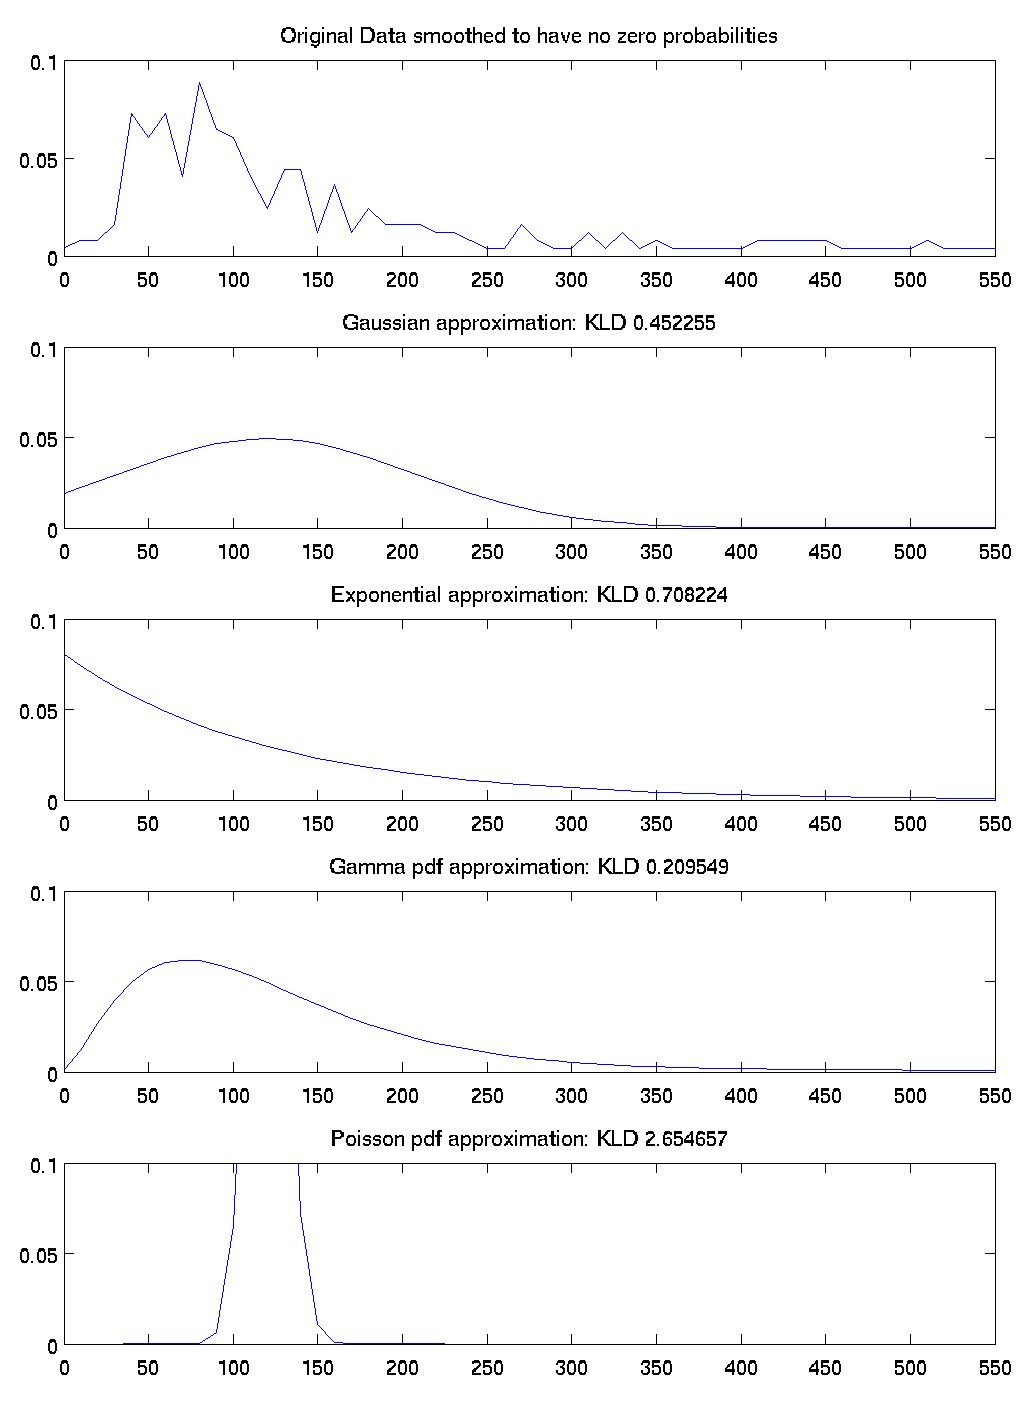
Here is some data that shows how well four different distributions match the true timing distribution in the data. To get these numbers, I took all the activities that were in the ADL dataset from Matthai's house and I ignored which activity generated them. I then generated a histogram of the activity durations. That is the first graph.
The subsequent graphs show a gaussian approximation with the same mean and std as the original data, an exponential approximation with the same mean as the original data, the maximum likelihood gamma-pdf approximation of the data, and an approximation of a Poisson distribution that matches the original data. For each of these graphs I calculated the KLD divergence of the approximation with the original data. According to KLD measures, the best fits were, in order, gamma, gaussian, exponential, and poisson.
So this justifies the choice of the gamma-pdf distribution for activity times, at least among these four options.
 Posted by djp3 at October 20, 2004 10:00 AM
| TrackBack (0)
Posted by djp3 at October 20, 2004 10:00 AM
| TrackBack (0)