

July 17, 2010
Resizing a VMWare LVM partition
 Photo courtesy of Tazintosh |
My problem was that I was running a virtual machine in VMWare that didn't have enough hard drive space. The underlying host machine did have more hard drive space. I wanted to increase the amount of disk space on the hosted virtual machine. Because linux tools (the main one being gparted) do not support increasing the size of an LVM partition this was hard. |
I understand how to do this now, but figuring out the right sequence of things to do required me to learn about LVM (logical volume management) and was a bear.
For starters:
The host machine was running Ubuntu Linux 2.6.28 server edition.
The virtual machine was runnning Ubuntu Linux 2.6.24 desktop edition.
The first thing to do was to increase the size of the disk that VMWare was giving to the virtual machine. I did that in the VMWare control panel while the virtual machine was shutdown. Alternatively I could have created a new hard disk for the virtual machine. It would have ended up being the same, although I don't know if there is a performance difference between the two.
Next I booted the virtual machine off of a live Ubuntu 10.04 iso image. This gave me a gui environment running on the virtual machine, but didn't mount the disk.
If gparted supported resizing an LVM partition I would have been nearly done. I could have opened gparted and resized the partition into the newly available space. gparted did not support resizing LVMs, so I had to learn more.
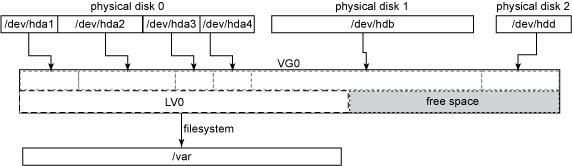
What I needed to do next was explained by this image taken from here.
From the gui, I opened a terminal window and got root access, "sudo su".
I created a new partition in the empty space using "fdisk". I set the partition type to "8e" which is "LVM". Then I wrote out the changes. At this point I had to reboot my virtual machine back into the live CD environment in order to get the changes to be seen when I ran "fdisk -l".
Next I made the new partition into a physical volume, (I ran "apt-get install lvm2" first) with the command, "pvcreate /dev/sda3". Verified it worked with "pvdisplay"
Then I added the new physical volume to the existing volume group, "vgextend Ubuntu /dev/sda3". I verified that it worked with "vgdisplay".
Then I extended the logical volume to include the new space with "lvextend -l +100%FREE /dev/Ubuntu/root". I verified that it worked with "lvdisplay"
Then I extended the underlying filesystem into the new space after cleaning it up with, "e2fsck -f /dev/Ubuntu/root" and then "resize2fs -f /dev/Ubuntu/root"
Then I ejected the .iso image from the virtual machine, rebooted it and the new disk was bigger! Yay! (In reality this took me a lot longer to figure out.)
One other useful command was "vgchange -a y" this enabled the Live CD Linux version to mount /dev/Ubuntu/root.
Thanks to this website for some insight into this.
Along the way I also shrunk the LVM partition and it's about the same thing in reverse, but you just have to make sure that you don't shrink things so much that you lose data. There are options in the tools that find out exactly how far you can go which was helpful. man pages are your friends.
(General Info) Permanent Link made 10:10 AM | TrackBacks (0)
Comments (3) Make a Comment
Thank you.
Posted by: mariusc at May 27, 2011 4:22 AM
Thank you so much, that worked flawlessly! You saved me hours of trial and error
Posted by: pierrickuk at August 17, 2011 7:05 PM
Thank you.
Posted by: mariusc at May 27, 2011 4:22 AMThank you so much, that worked flawlessly! You saved me hours of trial and error
Posted by: pierrickuk at August 17, 2011 7:05 PMMay 31, 2010
Cell-Phone Activity For Predicting Earthquakes
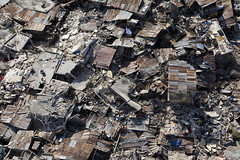 Photo courtesy of United Nations Development Programme |
An organization called Artificial Intelligence for Development (AI-D) recently had a workshop at Stanford which looked at ways that data driven statistical modeling and prediction could be used to help under-served populations in the developing world. One of the papers that came out of that conference was called "People, Quakes, and Communications: Inferences from Call Dynamics about a Seismic Event and its Influences on a Population". It was written by researchers at Microsoft and at the Santa Fe Institute, Ashish Kapoor, Eric Horvitz, and Nathan Eagle. They are all terrific researchers who have a much better track record than I do. The basic foundation for the paper was a large dataset of calls that were made in Rwanda in 2008. During this time frame an earthquake with a 5.9 magnitude occurred. The paper examined ways of determining: |
In terms of determining where an earthquake happened, the paper actually recognized that something unusual happened that affected call patterns. It was not correct to say that it recognizes earthquakes, but when applied to the data that contained an earthquake, it did recognize the earthquake as out of the usual.
In terms of determining where it happened, the paper assumed a model in which the the degree of unusualness fell off with the proposed distance from the closest call tower. The problem of finding where the earthquake occurred then reduced to a search over all locations for the location that best explained the observed disruption. I think this approach would work for a brief moment after an earthquake occurs, when call pattern disruption is dominated by calls in and out of the immediately affected area, but I think that very quickly calls would start being made all over the place as word spread regionally. This approach also assumes that an earthquake only really affects one location, that locations are defined by the cell phone towers and that there is a cell phone tower where the earthquake occurs.
In terms of the final contribution, I didn't understand the paper's approach. At a high level it was a decision theoretic approach that argued for surveying unknown locations that reduce uncertainty the most. But in terms of cell-phone data, how is it that you don't have the data already? What does it mean to go survey an unknown location for cell-phone activity? The math was pretty complex when you start to apply the DT approach, so I may have missed something here. Nevertheless the motivation was cool. Wouldn't it be nice to have a disaster management computer that told you where you would benefit the most by sending scouts?
Despite my critique, this paper was exciting because it contained real meaningful data and took a well-grounded stab at solving an important and hard problem.
(Paper Review) Permanent Link made 5:14 PM | TrackBacks (0)
Comments (0) Make a Comment
March 20, 2010
Ripping a TurboTax DVD image to an .iso file on a Mac

|
I have a copy of TurboTax that I want to install on a Windows virtual machine. In order to do that I need to insert the DVD in the underlying host hardware first. Unfortunately that requires physical access to the host hardware which I don't have right now. Instead what I want to do is to send a software image (.iso file) of the DVD to the host machine over the network, have the host machine mount the .iso file and then my virtual machine will think the DVD is inserted in it's hardware. Further complicated matters is the fact that I have a MacBook Pro running OSX 10.5.8. |
Since the Mac mounts the disk in a different way from the way Windows mounts the disk, I first need to make my Mac mount the disk like a Windows box would. Here is what I did based on this hint:
- I inserted the disk into my Mac
- executed:mount, to figure out which disk I was working with
- executed:sudo umount /Volume/TurboTax\ Premier\ 2009, to disconnect from the disk without ejecting it
- executed:mkdir /Volumes/Turbo.win, as a new mount point
- executed:mount_cd9660 -er /dev/disk2 /Volumes/Turbo.win, to mount the disk as a Windows box would.
Now I can cd to Turbo.win and see all the windows files that were hidden from me when I used the natural Mac mounting technique of inserting-the-disk-in-the-drive.
So I now I need to rip the DVD into an .iso file which I based on this hint
- execute: dd if=/dev/disk2 of=myFile.iso
Voilá all done. Then I compressed the file. Sent it across the network. Decompressed it. Mounted it, and installed TurboTax on my virtual machine.
A few cleanup steps are to eject the disk on my Mac. diskutil eject /dev/disk2, and to erase the mount point, rmdir /Volumes/Turbo.win
(General Info) Permanent Link made 10:58 AM | TrackBacks (0)
Comments (0) Make a Comment
March 11, 2010
Fixing a broken built-in iSight on a MacBook Pro running 10.5.8

|
Props the telephone tech support at Apple who treated me like I had a brain and quickly helped me to fix my problem with my broken MacBook Pro built-in iSight. He said that the following procedure fixes about 40% of built-in iSight failure cases.
Thank you Apple, you did a great job! |
(General Info) Permanent Link made 12:55 PM | TrackBacks (0)
Comments (0) Make a Comment
March 2, 2010
Real-Time is Prime-Time for Scams
 Photo courtesy of th.omas |
I had a brief panic earlier this week. For a few hours I thought the Internet was on the verge of collapse. The sudden concern was brought about by trying to find season 1 episode 1 of "Glee" online somewhere. My first thought was to go to Hulu.com as this has become my new authority for legal online television. It turns out that only the last 5 episodes of Glee are available on Hulu. A fascinating conversation with a Fox executive taught me about how that is the result of a legacy method of licensing the content for television programs that has been shoehorned into the Internet TV age. It used to be that shows followed a path from brand-new to syndication in a well-ordered manner which doesn't match well with the expectations the public have of finding all shows archived on the Internet somewhere. That, however, is tangential to my panic. |
Unsuccessful on hulu, I started doing just a general Google search and turned up many many many pages purporting to be Glee Episode 1 Season 1, but were really just gateway videos to ... you guessed it ... porn.
I immediately related this experience to the resulting aftermath of the Haiti and now Chile earthquakes in which immediately following both disasters, internet sites sprang up which fraudulently offered to take donations on behalf of victims or redirect you to their issue / product of primary concern which was rarely related to the disaster.
A final example of this effect comes from Twitter. In the Twitterverse whenever a meme is created, usually with a hashtag, it is not long after that the griefers and scammers show up. They post their VIAGRA ad with the hottest twitter meme hashtag and destroy the conversation for everyone else.
My panic peaked at this point? How has the internet survived so long in the face of this stuff? Has it just grown to the point where this is now economically feasible? Are we in a new era of the web which looks like the spam-era of email? As part of the work that I've been doing on Information Retrieval I was able to consider how powerful the signal from PageRank must be to overcome this: To have been overcoming this for so long.
PageRank, is a technique in which links from one page to another confirm authority on the destination page. The paths that people can take through the Internet by following links therefore reveal a great deal about where the good content is and where the bad content is. The links represent the efforts of human curation on the Internet. Every link that you put on your web page helps PageRank sifts the garbage from the gold.
However, this doesn't work with real-time information because PageRank is pretty slow. It takes time for people to add those links. It takes time to figure out the shape of the Internet and it takes time to report the results back to Internet searchers. Apparently it takes more than half a season of Glee, because I can only find garbage today.
So PageRank works well for archived data, what can work for real-time data? Maybe social networks can. If you can leverage social networks to immediately vote on the content being created by the real-time web, then perhaps the social network can replace PageRank for ephemeral data. All that remains is a way of figuring out what people think is good or bad in the same way that looking at a link tells you whether people think content is good or bad.
So what started out as a panic that the Internet was about to collapse, really gave me a new appreciation for PageRank. In some ways the link structure of the Internet is the social network that we have been leveraging all along. My panic also made me realize that we need a new signal for real-time ephemeral data - like news and tweets - to sift the good from the bad. My panic has subsided now that I know the shape of the problem a little better. I think the problem is large, but it would be cool to solve it.
(Musings) Permanent Link made 12:44 PM | TrackBacks (0)
Comments (0) Make a Comment
February 26, 2010
Twitter During Emergencies
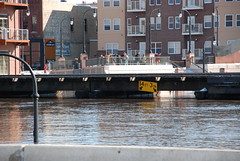
Photo courtesy of DahKohlmeyer |
A few months ago on the University of California, Irvine campus we had an incident in which a student wearing camouflage was seen walking onto campus from secondary road coming from a somewhat remote area (grain of salt: we are in Irvine of course). Given the stories about violence on campus that are consistently told in the main stream media, this caused people who saw him to become alarmed. The fear was that his intention was to massacre a number of students in a Virgina Tech style rampage. What followed was an explosion of real-time information sharing. It was an extremely heterogeneous mix of media that was involved however. One system that was involved is called ZotAlert. It is a terrific text-message based system that is used by the UCI Police to send text messages about emerging danger to the entire University community. It has been used to warn about violent incidents occurring in and around campus as well as burglaries and other crimes in a very short window of time after they are reported. Of course, individual text messaging, facebook, twitter, email and a variety of less well known social media were involved in the explosion of information. But so were face to face conversations and standard phone calls. |
I remember that the first information that I received was from my wife who was talking to a friend who had received a text message from another friend relaying information from mobile phone call with her daughter! The message that was relayed was that they were in lock-down at the pool and there was a guy running around with a gun shooting people.
Then I read a Facebook report that the guy had a Nerf-Gun. I synthesized and retweeted those two bits of information and was emailed by a reporter from the O.C. Register who wanted to confirm my update that he saw on Facebook. I, of course, couldn't confirm it as I was just passing along information that I had heard.
Later, a student wearing camouflage was arrested in the student union which was also in lock down at the time. It eventually turned out it was the wrong guy who made an unfortunate fashion choice that morning.
Hours later the information flood settled down and it was revealed that the guy with the gun was a student with a paint-ball gun who was shooting paint balls in the field and was going home. He was mostly oblivious to the craziness going on around him because he wasn't online and he wasn't apprehended in any reasonable amount of time. He eventually apologized profusely for being dumb enough to carry a paint ball gun onto a college campus and being seen.
I had a couple of observations about this event. The first was that the ZotAlert system was very authoritative, and not surprisingly was slower to send out the facts. This was, hopefully, because they were trying to make sure they actually had facts.
Another observation was that the social media was extremely effective at getting out the word that something was going on. The subject and accuracy of the something varied to a great degree. When it comes to a potentially dangerous situation like this could have been I think that this was a success. Even if you can't communicate the right information, you would like everyone to be on guard and in the right frame of mind to respond appropriately when they get first hand information.
Lastly it was interesting to see how much this media space is fractured. Every social media tool I was involved with was lighting up. No tool had a monopoly on the communication. They were each used to individual strengths and to communicate to particular people. It appears that our community has a pretty good sense of which tools different people pay attention to. So when I want to reach my wife I text message, but if I want to reach my department I send an email.
In the paper "Chatter on the Red: What Hazards Threat Reveals about the Social Life of Microblogged Information" by Starbird, Palen, Hughes and Vieweg and published in CSCW 2010, the authors look formally at some of these effects.
Their data source were tweets that were sent out around the time of a 2009 flood in the Red River Valley on the U.S/Canada border. This event lasted for several months, so the nature of the information was much less about being individually safe for the next few hours and much more about being safe as a community for weeks.
They commented on the fractured and heterogenous nature of social media:
"Collection and analysis of large data sets generated from CMC [Computer Mediated Communication] during newsworthy events first reveals an utterly unsurprising observation: that publicly available CMC is heterogeneous and unwieldy. ... Our tweet-by-tweet analysis of the Local- Individual Users Streams indicates that most are broadcasting autobiographical information in narrative form, though many contain elements of commentary and the sharing of higher-level information as well. Even as some Twitterers shift focus to the flood, most continue tweeting within their established Twitter persona."
and although they had contradictory comments about what Twitter was this quote reinforced my view that as a technology, Twitter is an infrastructure for low-bandwidth multicast.
" Twitter, a new incarnation of computer mediated chat, is a platform without formal curation mechanisms for the massive amount of information generated by its (burgeoning) user base. There is no rating or recommendation system support—key features of commerce sites like Amazon and information aggregators like Digg. Nor is there a complex system of validation that, for example, Wikipedia has implemented. Also unlike Wikipedia, content passed through Twitter is short-lived, and therefore cannot be discussed, verified and edited. While most social media have “places” for interaction, interaction in Twitter occurs in and on the data itself, through its distribution, manipulation, and redistribution. Without regular retransmission, communications quickly get lost in the noise and eventually die off."
Another difference between UCI and this flood, was that the time scale allowed people to do more self-organization and to create more digital tools to help manage the information flow than would be normal over the course of hours.
The authors reinforced a belief about geo-located data that I previously blogged about which is that there is nothing about twitter which should make you think that localized data is really more local. It is a means to broadcast and subscribe and what you do on top of that is communicate. Just like all communication it is human centered and not easily parsable by a machine. So the researchers spent a lot of effort curating a set of tweets that were related to the flooding. There was one caveat which I'll mention below
Some interesting facts that emerged from their study were that only about 10% of the tweets that were in the dataset about the floods were original. And of that 10%, it was split between autobiographical narrative format and knowledge introduction. This is the same pattern of use seen in "Is It Really About Me? Message Content in Social Awareness Stream" between Meformers and Informers.
A curious note about this dataset though was that the localized data was three times as likely to be original. This is a reasonable expectation given the dataset but speaks to a place in which the merging of local and localized data does occur.
Those that weren't original were sometimes synthesizing other tweets. This included editing, curating and synthesized the data from others. Then another group of people were posting educational tweets related to the events unfolding.
A final interesting behavior that was observed was the sensor stream to twitter account phenomenon in which some talented folks connected a sensor measuring flood levels to a twitter stream which periodically tweeted data. This is something I would like to explore in much greater depth.
(Paper Review) Permanent Link made 9:48 AM | TrackBacks (0)
Comments (0) Make a Comment
February 25, 2010
Using social networks to guide recommendation systems
 Photo courtesy of Walt Jabsco |
The problem of trying to incorporate social networks into collaborative filtering recommendations seems to be a hot research topic right now. The basic idea of this problem is that one may have a dataset consisting of many different ratings by a user of a thing, like a movie or product, which takes on a number from 0 to 1. What we would like to do is to predict how much a given user will like something which they have never rated before. In collaborative filtering the approaches have two axes user/item similarity and memory based or model based approaches. The first axis describes what kind of similarity you are leveraging in order to make your recommendations. User similarity asserts that people who have rated things similar to you in the past are likely to rate a new thing in the same way. Item similarity assets that you are likely to rate a new thing the same way that you have rated similar things in the past. The first requires a way of determining whether users are similar, the latter a way of determining whether items are similar. In either case you can just use your ratings themselves as the basis for similarity or you can use some external knowledge to judge similarity. The second axis describes how you store the information from which you base your decisions. In a memory based approach, you just keep all of your rankings around and when it comes time to make a new rating on an unseen item, you go to your data and do your analysis. In a model-based approach, every time a new rating is observed, a new model is constructed for a user. When it is time to rate a new unseen item, then the model is consulted for a rating. |
Two recent papers that explore these issues are "On Social Networks and Collaborative Recommendation" by Konstas, Stathopoulus, and Jose and "Learning to Recommend with Social Trust Ensemble" by Ma, King and Lyu, both from SIGIR 2009.
The first paper, "On Social..." undertook the task of trying to create a list of songs that a user would like based on their previous history of listening to songs in Last.fm, who their friends are (and their history), and then a collection of tags which applied to users and music. There approach was an attempt to merge both user and item similarity with a social network in a memory based approach. Because they ultimately created a play list sorted by most-likely-to-be-liked, they had a hard time comparing their results to traditional collaborative filtering systems which produce a hypothetical how-much-do-you-like-a-song rating for every song given a user.
Their approach was very interesting to me because they basically created a graph in which users, songs and tags were nodes and the relations between them were represented as weighted edges in a graph. Then they ran the PageRank algorithm over the personalized graph, pulled out the songs in the graph that were mostly highly rated and that was the recommendation. The weights on the edges of the graph required some black magic tuning.
It appears that any memory-based system that has significant computation, like the previous one, suffers from a real-time response challenge. If you are creating a system like Pandora, it's not really a problem because you have quite a bit of time in which to pick the next song about as long as the current song takes to play.
But if your system is more of a query-response system where you ask "Will I like song X?" then you really only have milliseconds to get an answer. This suggests to me that a model based approach is nearly required in fast-response systems.
The second paper, "Learning to Recommend..." was similar in spirit but very different in execution. The goal of the authors of this paper was to create a recommendation system of products based on the reviews in Epinions.com. The key feature that the authors wanted to include was a social-recommendation component and the basic assumption they were exploring: What you like is based on a combination of your own tastes and the tastes of your social network. When it comes to epinions this work shows that to be true in a 40/60 split respectively.
So they cast the problem of collaborative filtering as a graphical model and used results that showed how the matrix manipulations associated with collaborative filtering can be solved as just such a model. Then they showed how as social graph can also be cast as a graphical model. So the first graphical model says how likely you are to like something based on your previous history of ratings and the second component says how likely is your social network likely to like something. Then they combined the graphical models and derived an optimization technique for finding a local optimal solution to the matrix problem in the beginning. The result was a model that performed a query on an item quickly and did better than simply looking at a users tastes by themselves, or a social networks tastes by themselves.
(Paper Review) Permanent Link made 10:14 AM | TrackBacks (0)
Comments (0) Make a Comment
February 24, 2010
Twitter is a Low-Bandwidth Multicast Internet
 Photo courtesy of hockadilly |
In the paper "Is it Really About Me? Message Content in Social Awareness Streams" by Mor Naaman, Jeffrey Boase, and Chih-Hui Lai and published in CSCW 2010, the authors look at Twitter messages and attempt characterize what is going on in a representative sample of Twitter users' communication. Personally I believe that Twitter is fundamentally an infrastructure play. I think that "Twitter" is going to become a series of extremely well-engineered pipes that enable people to post information and receive information from an infinite number of streams. It is basically recreating the Internet as something which is based on multi-cast rather than being based on one-to-one connections. Or seen another way they are becoming a new radio spectrum for the Internet. Tune in or tune out as you will. This is phenomenally valuable. It is doing what the Internet did for archival information to ephemeral information. Most analysis, including the one cited above, however, treat Twitter as if it is a consumer grade tool. In my mind, that is like saying that you need to study the water pipes in your neighborhood to see how people are using them. Basically, they use water pipes to get water. There isn't much more to say about it. After that, you are studying what people do with water, not with the infrastructure that delivers it. At this point of course, we've never seen this type of water pipe, so it still makes sense to look at both the pipes and the content. |
This study does this. It doesn't do it naively though. It talks about Twitter as being one of many "social awareness streams" through which people communicate to each other. Then the authors go on to study the content of these streams.
What they found is fascinating. For example, in support of my claim that Twitter is really an infrastructure for ephemeral data, they found that in the random sample of 3379 messages spread across 350 users who were active in Twitter and used it for non-commercial purposes, over 196 different applications were used to put information into Twitter. That blew my mind. I know about 10 applications that post to Twitter but 196 actively used applications, amazed me.
Another fascinating fact, that has also been reported by Pew researchers is that 25% of the posts were from mobile platforms. It think this speaks more to the growth of mobile networks and smart phones than it does about real-time data generation. I suspect that in the same way that phone calls are becoming more and more dominated by mobile connections, Twitter will eventually be almost entirely mobile. That's not the nature of Twitter as much as it's the nature of the future network.
So using open coding methods the authors took the 3379 messages and developed a categorization for them and then had independent coders assign categories to each message for analysis.
The results were that the dominant minority of messages were categorized as "Me Now" messages - messages that described what people were feeling or doing at that moment. Messages were categorized this way 41% of the time. The frequency went up to 51% when you considered just mobile messages.
This lead to an attempt to categorize people into personas which described two types of people, those who were "Informers" - passing links along, or people who were "Meformers" passing their personal context along. The authors left as open work the task of what structural properties of the social graph characterized these two groups.
So although I believe that Twitter is primarily an infrastructure for low-bandwidth multicast, it is still new enough that studies like this one, that characterize emergent ways that people are using it are valuable and informative. It confirmed some of my intuitions, and helped put some numbers to the trends.
(Paper Review) Permanent Link made 9:26 AM | TrackBacks (0)
Comments (4) Make a Comment
I don't think it can become infrastructure - it's not an open protocol, its business model has yet been defined, and attrition is astronomically high. A business with negative customer attrition will inevitably fade into obscurity.
Posted by: at February 26, 2010 4:30 AM
Whether or not they will succeed at being infrastructure is a business issue and absolutely depends on audience, marketing, usefulness, etc. But the service they are providing from a technical perspective is an infrastructure play.
They are becoming the place to publish and the place to subscribe.
I think a company on the web who doesn't offer something technically new has a much harder time of creating a successful business out of their product.
It is too easy to copy other people and too easy to give something away for free to be viable otherwise.
Posted by: Don at February 26, 2010 6:57 AM
i think i'm missing something here. what do you mean when you say 'infrastructure for low-bandwidth multicast'? as opposed to what?
Posted by: judy at February 26, 2010 6:13 PM
Well, sometimes people saw that Twitter is one thing or another. Like they will say that "Twitter is really just a forum" or "Twitter is really just a way to have a real-time conversation"
Because Twitter, the company, doesn't do very much to guide usage of their system, I think it is more appropriate to identify what Twitter "is" by its technological affordances rather than it's usage model.
So from that perspective I think Twitter is best understood as a company that has taken over publication and distribution of short text messages. RSS feeds separated out those two concerns. Publication and subscription were independent and facilitated by the Internet. Twitter has grabbed both of those functions.
I say it is low-bandwidth because I'm imagining trying to have a radio stream that plays over Twitter. Old-school multicast was all about this. I don't think Twitter could handle many people encoding audio into 140 characters for distribution.
Posted by: Don at March 2, 2010 1:08 PM
I don't think it can become infrastructure - it's not an open protocol, its business model has yet been defined, and attrition is astronomically high. A business with negative customer attrition will inevitably fade into obscurity.
Posted by: at February 26, 2010 4:30 AMWhether or not they will succeed at being infrastructure is a business issue and absolutely depends on audience, marketing, usefulness, etc. But the service they are providing from a technical perspective is an infrastructure play.
They are becoming the place to publish and the place to subscribe.
I think a company on the web who doesn't offer something technically new has a much harder time of creating a successful business out of their product.
It is too easy to copy other people and too easy to give something away for free to be viable otherwise.
i think i'm missing something here. what do you mean when you say 'infrastructure for low-bandwidth multicast'? as opposed to what?
Posted by: judy at February 26, 2010 6:13 PMWell, sometimes people saw that Twitter is one thing or another. Like they will say that "Twitter is really just a forum" or "Twitter is really just a way to have a real-time conversation"
Because Twitter, the company, doesn't do very much to guide usage of their system, I think it is more appropriate to identify what Twitter "is" by its technological affordances rather than it's usage model.
So from that perspective I think Twitter is best understood as a company that has taken over publication and distribution of short text messages. RSS feeds separated out those two concerns. Publication and subscription were independent and facilitated by the Internet. Twitter has grabbed both of those functions.
I say it is low-bandwidth because I'm imagining trying to have a radio stream that plays over Twitter. Old-school multicast was all about this. I don't think Twitter could handle many people encoding audio into 140 characters for distribution.
Posted by: Don at March 2, 2010 1:08 PMFebruary 23, 2010
Local data vs Localized data: When are they the same?
 Photo courtesy of future15pic |
I've been thinking about geolocated status messages a bit recently and have just started to look into studies that have been conducted about such data. This started after I had seen some pretty cool visualizations of Facebook data that was geocoded. What the visualizations showed was a globe. Emanating from the globe were icons that corresponded to events that were happening around the world (on facebook) which were also associated with a latitude and longitude. It was amazing to see the activity occurring visually. As you watch you can see people waking up with the sun and making friends across the globe. After a few minutes though I began to wonder if any of this mattered. It was certainly cool to see something like this, because basically it had never been seen before, but I began to wonder if the location from which the data was generated really mattered. So I did a little follow-on experiment. I looked into the Twitter API and ran an experiment over a week. For one day I looked at all the geo-tagged tweets coming from the UCI campus (generously defined). Then over the course of 6 days I looked at all the tweets coming from the U.S. Capital and about 4 blocks in all directions. I was very surprised to see that only 2 tweets emanated from UCI's campus and a similar number came from D.C. So about 2 tweets per day for a large geolocated area. The tweets were not very local either. In UCI's case, one was a tweet meme about Toyota's recent recall problems and the other was a Four Square check-in. In D.C.'s case the results were similar. This was a surprise to me because I was led to believe (by the media, I suppose) that there is a flood of geotagged tweets arising around us. If only you could tap into this stream you would be amazed at the richness of information around you. That turned out to just not be true at all. Now, I've begun to think of geotagged data more like email. Why would you expect that the location where you sent an email from was correlated with the content of the email? Certainly some of it is. And certainly some of the content is being made because of the location. But it isn't like the content is all about the location. As if every email that I sent from my office was some description of my office. I believe the same pertains to Twitter, Facebook etc. Generally speaking, there isn't any reason to think that geotagged status updates are related to the content any more than you would expect email to be related to the location from which it is sent. My attention to the issue has caused me to read to papers recently about the issue. The first is "Where We Twitter" by two students in my department, Sam Kaufman and Judy Chen. It isn't a huge contribution, but it makes the point that there are some use cases for good local data and they brought out the distinction that I just described above by naming two types of information, "localized data" and "local data". I was mostly complaining about localized data above. That is data which has a place where it was generated but which is not necessarily about the place. This is in contrast to "local data" which is about a location, but wasn't necessarily authored in that location. Geotagged tweets conflate the two types of information. The second paper was more rigorous and was published in CSCW 2010, called "On the 'Localness' of User-Generated Content". In this paper, the authors, Brent Hecht and Darren Gergle study how much local data is generated from near the same location. The high order take away bit was that there was a lot more alignment in Flickr's data of local data being localized at the same location. Wikipedia in contrast does not tend to have nearly as much local data generated near the location. A simple, but interesting explanation is that the easiest way to localize Flickr photos is to take a photo with a camera that automatically tags it with a location. So entering local data in Flickr requires you to actually be at the location. |
(Paper Review) Permanent Link made 10:02 AM | TrackBacks (0)
Comments (1) Make a Comment
I think a third takeaway from our (super brief) paper is that, while not every email sent from your office is about your office, almost every email sent from your office is, in some sense, about you. We take that idea out onto a ledge by saying that, for instance, tweets sent from the café, or West Hollywood, or the gun range are about the group of people frequenting that place.
Maybe. We have some algos and visualizations in the works that should help us figure it out.
(commented from my iphone, Flame Broiler, irvine, ca, USA)
Posted by: Sam at February 23, 2010 1:18 PM
I think a third takeaway from our (super brief) paper is that, while not every email sent from your office is about your office, almost every email sent from your office is, in some sense, about you. We take that idea out onto a ledge by saying that, for instance, tweets sent from the café, or West Hollywood, or the gun range are about the group of people frequenting that place.
Maybe. We have some algos and visualizations in the works that should help us figure it out.
(commented from my iphone, Flame Broiler, irvine, ca, USA)
Posted by: Sam at February 23, 2010 1:18 PMDecember 9, 2009
Grants for Young Faculty at UCI
- NSF CAREER
- Packard Fellowship for Science and Engineering
- Microsoft New Faculty Fellowship
- Sloan Research Fellowship
- UCOP Opportunity Award
- UCI Faculty Career Development Award
- UCI Faculty Desktop Computing Initiative
- UCI Distinguished Assistant Faculty Award for Research/Teaching/Service
- UCI CORCLR Multi-Investigator
- UCI CORCLR Single Investigator
- UCI SURP (summer support for undergrads)
- Calit2 SURF-IT (summer support for undergrads)
- ICS Collaborative Research Initiation Awards
- ICS Smith Family Seed Fund
- ICS CORCLR
(General Info) Permanent Link made 1:50 PM | TrackBacks (0)

This guide was perfect. Thanks a bunch man! You took the pain out of trying to figure all this out.
Posted by: Spike at November 18, 2010 6:24 PM