January 11, 2005
IJCAI update

|
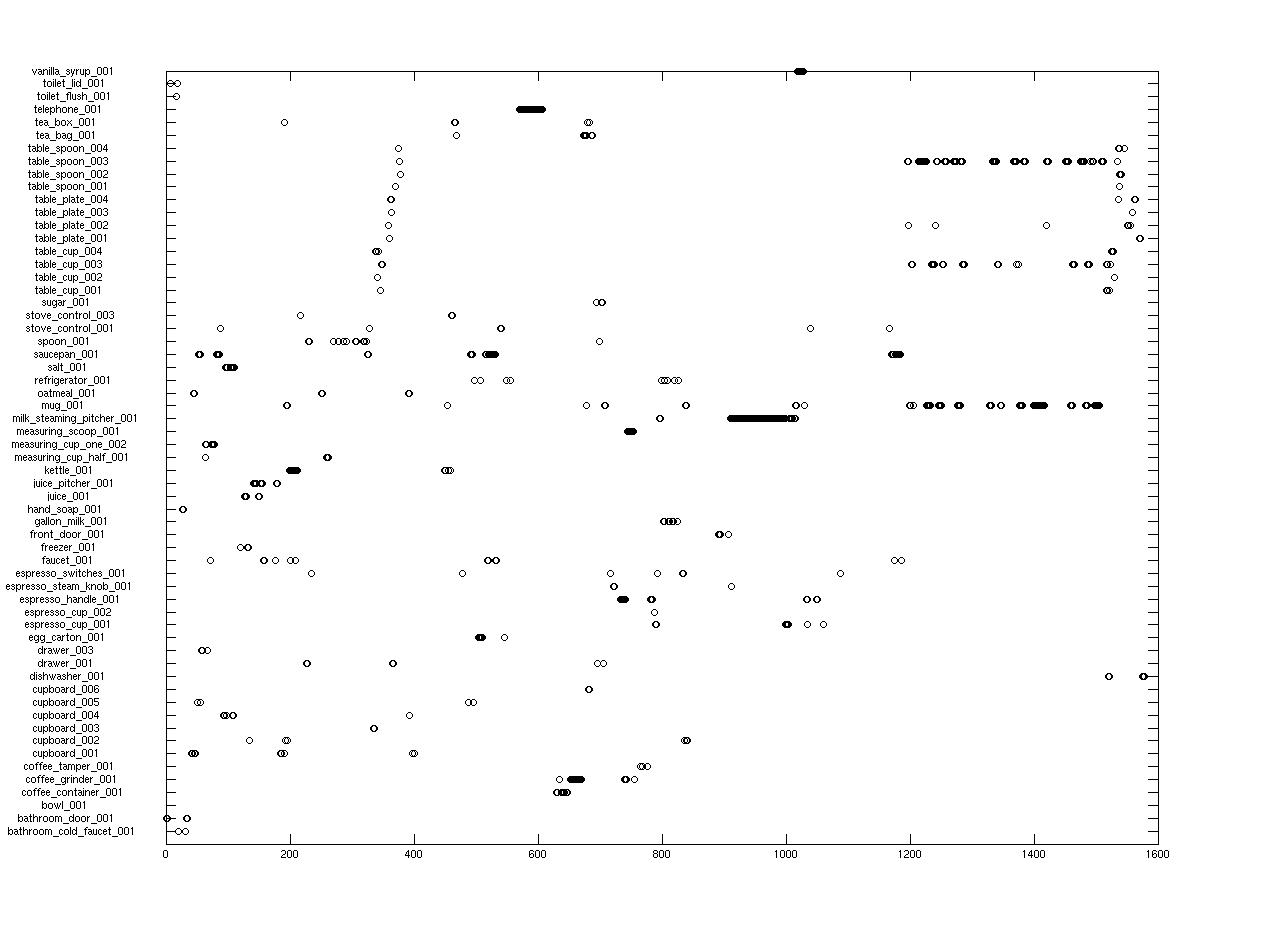
| Here is a viz of the data run from this morning. x axis is time in seconds. y axis is objects. A circle is an observation. Some features to note are the vertical stripe on the upper left...that is setting the table. The three horizontal lines on the upper right are eating... The dark swatch of hits in the middle is steaming the milk for espresso! |
Comments
Post a comment

