

January 21, 2005
IJCAI update
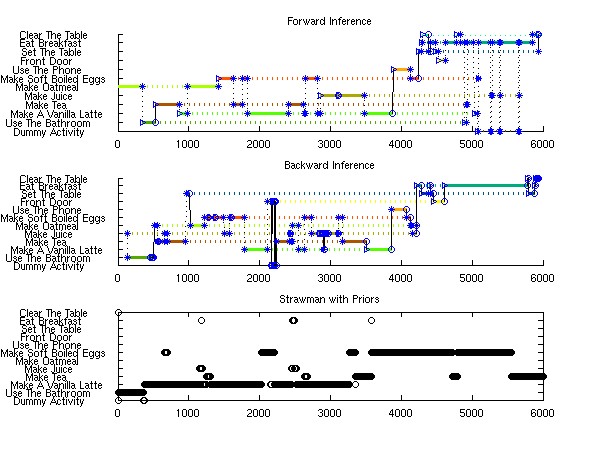
Today, I took some time out to make sure our straw man was going to do badly. The above graphs confirm this. The top graph is of forward particle filter inference with hand made models as priors and no training. Second is a graph of backward particle filter inference with hand made models as priors and no training. I've posted these graphs before. Third is a graph of exact DBN inference on a model with one state per activity and a fully connected state space. The third graph uses a sensor model which was trained on the labelled examples of runs when I performed single activities by themselves. All three graphs assume a uniform transition between activities. None of these graphs were trained on the full breakfast runs which would help them learn which activities follow eachother.
The conclusion I draw from this is that the simple solution does not look like it is going to do very well. The final word will come after I train it on the full breakfast runs. But this is a good result. The main problem with the third model is that it quickly switches to whichever activity has the highest probability of seeing the current observation. It doesn't happen immediately, but if the same object is seen in rapid succession, it overwhelms the tendency of the model to stay in the same activity.
Now on to learning with particle filters
January 20, 2005
IJCAI update
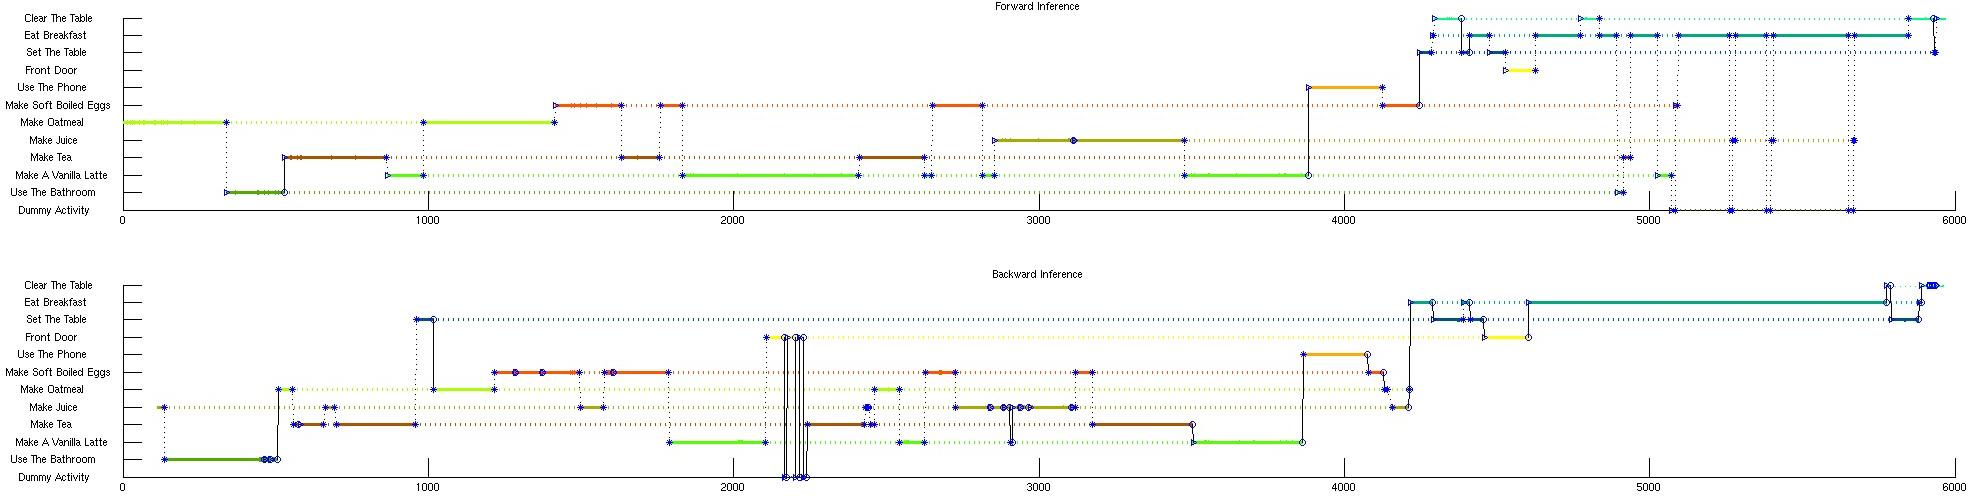
Okay, backward inference seems to be done. Here is a graph comparing the two inferences.
The top is forward inference. The bottom is backward inference. They both seem to perform better in different portions of the state space. That is a great result. Now on to learning...
January 18, 2005
IJCAI update
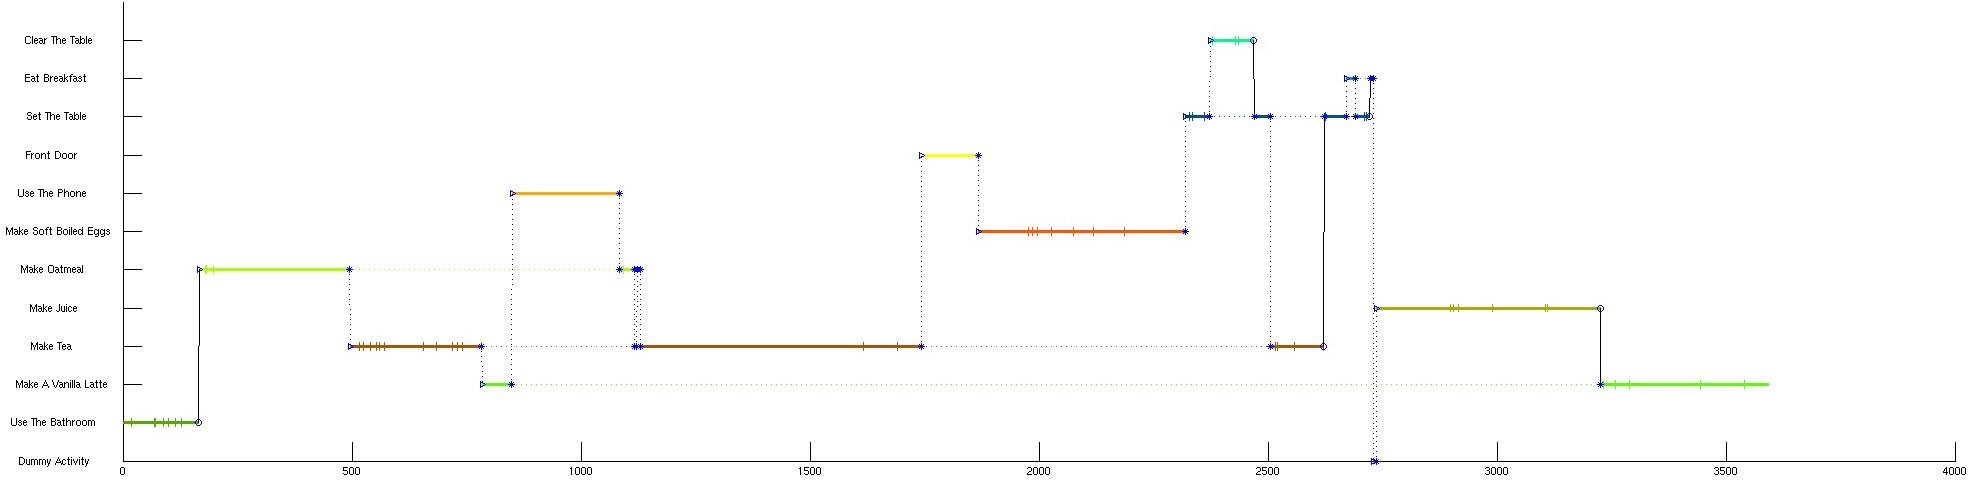
Forward approximate inference on the data is complete. The image above shows the results of filter the data forward. The x axis is time. The y axis is "activity". There is a heavy colored line when the activity is actively making progress and a dashed line when the activity is in progress but not being attended to by the user. The black vertical lines show the flow through the primary focus of attention. A triangle indicates the start of an activity, a star indicates an activity interruption and a circle indicates the end of the activity. There are little vertical tick marks on the colored lines which indicate that the next step of that activity has begun. I don't actually know how accurate this particular run is, but I can see that there is some confusion at the end about setting the table, clearing the table and eating.
The next step is backward inference. Then learning, then smoothing.